在做回归分析时,求最佳拟合曲线通常采用最小二乘法来求解。最小二乘法是一种数学优化方法,它通过最小化误差的平方和来寻找数据的最佳函数匹配。
采用statsmodels进行回归分析
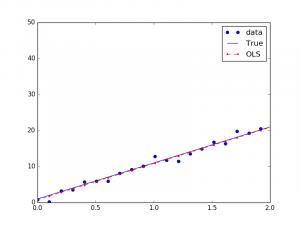
如果只包括一个自变量和一个因变量,且二者的关系可用一条直线近似表示,这种回归分析称为线性回归,如Y=1+10X。
采用statsmodels进行线性回归分析,同时假设回归数据中存在误差项,其满足正态分布:
'''Artificial data'''
## Y=1+10*X
nsample = 100
x = np.linspace(0, 10, nsample)
x_ = x
X = sm.add_constant(x_)
beta = np.array([1, 10])

'''Our model needs an intercept so we add a column of 1s'''
e = np.random.normal(size=nsample)
y_true = np.dot(X, beta)
y = y_true+e

'''Fit and summary'''
model = sm.OLS(y, X)
results = model.fit()
y_fitted = results.fittedvalues
print(results.summary())
print('Parameters: ', results.params)

'''Plot figure'''
fig, ax = plt.subplots(figsize=(8,6))
ax.plot(x, y, 'o', label='data')
ax.plot(x, y_true, 'b-', label='True')
ax.plot(x, y_fitted, 'r--.',label='OLS')
ax.legend(loc='best')
plt.show()
可以得到结果:
                            OLS Regression Results
==============================================================================
Dep. Variable:                      y   R-squared:                       0.999
Model:                            OLS   Adj. R-squared:                  0.999
Method:                 Least Squares   F-statistic:                 9.986e+04
Date:                Wed, 30 Aug 2017   Prob (F-statistic):          3.05e-149
Time:                        10:52:33   Log-Likelihood:                -133.16
No. Observations:                 100   AIC:                             270.3
Df Residuals:                      98   BIC:                             275.5
Df Model:                           1
Covariance Type:            nonrobust
==============================================================================
                 coef    std err          t      P>|t|      [95.0% Conf. Int.]
------------------------------------------------------------------------------
const          0.9654      0.184      5.254      0.000         0.601     1.330
x1            10.0320      0.032    316.009      0.000         9.969    10.095
==============================================================================
Omnibus:                        7.078   Durbin-Watson:                   1.883
Prob(Omnibus):                  0.029   Jarque-Bera (JB):                6.548
Skew:                           0.583   Prob(JB):                       0.0379
Kurtosis:                       3.461   Cond. No.                         11.7
==============================================================================

Warnings:
[1] Standard Errors assume that the covariance matrix of the errors is correctly specified.
('Parameters: ', array([  0.96540594,  10.03203855]))
我们真实的系数是1和10,回归的系数是0.96540594和10.03203855,也就是回归曲线为Y=0.96540594+10.03203855*X。
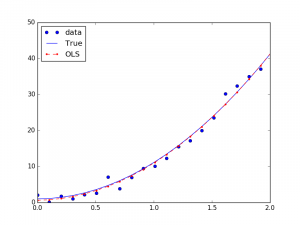
如果是非线性回归,如Y=1+0.1X+10X^2,也可以转换成线性回归的方式求解:
## Y=1+0.1*X+10*X^2
nsample = 100
x = np.linspace(0, 10, nsample)
x_ = np.column_stack((x, x**2))
X = sm.add_constant(x_)
beta = np.array([1, 0.1, 10])
最小二乘法与极大似然估计
前面的线性回归分析中model.fit()函数采用了最小二乘法,通过最小化误差的平方和来计算拟合模型的参数。为什么会将误差的平方和作为线性回归分析的损失函数呢?
假设我们要拟合的平面:
自变量和因变量存在线性关系,除此之外,允许引入误差:
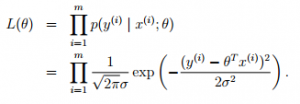
从概率的角度上讲,假设误差符合正态分布,则有:
求最佳的拟合模型,也就是需要寻找使得损失函数L(theta)最大的参数theta,这个损失函数也就是似然估计。如果所有的样本都是在独立同分布(Independent Identical Distribution, IID)的,极大似然估计认为,如果某个参数使得样本出现的概率最大,就把该参数作为估计的真实值。
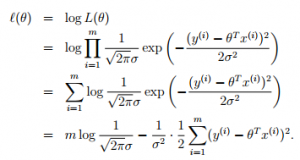
对似然估计取对数,将“求积”转换成“求和”的形式:
因此,求解极大似然估计,转换为,求解最小化误差的平方和:
对于误差的平方和,我们对其最小化的过程中,往往使用梯度下降法,而误差的平方和函数,恰恰方便了对参数的“求导”。因此,对于最小二乘法来说,将误差的平方和作为线性回归的损失函数是一个很自然而然的选择。
转载请注明:宁哥的小站 » 回归分析中的最小二乘法


